Who are the winners of Dutch Design Awards? What drives them and what is their vision of design? This time in the Winner’s Portrait series is Gert Franke, co-founder of data visualisation design agency CLEVER°FRANKE. Together with his team, he won a Dutch Design Award in the category Service & Systems for the 3D real-time data visualisation for the National BMX Freestyle Park Championships.
 1
1
After studying at the Utrecht School of Arts, you started a design agency together with fellow student Thomas Clever, where you soon specialised in data visualisation. Why this choice?
‘We started as a graphic design agency and we quickly realised that we were most enthusiastic about the more substantive jobs that went beyond the usual corporate identities, books and websites. We are creatives who like to think in an abstract way. Working with data was the solution for us. This was relatively new ten years ago; there were no strict guidelines or specific customer demands. This gave us the freedom to innovate and was also an exciting process. In order to get noticed, we made our very first CLEVER°FRANKE weather map, upon which we visualised the weather for every day of the year in a creative way. This was really the key project that sparked the interest of potential clients.’
When does data become good design?
‘I see data mainly as content. Only when you do something with it can you see whether design is an option. Design can be seen as a problem solver, and a good design can help to organise data and make it clear. But data itself can also turn out to be the solution for a design problem. Working with data is always a fluid process for us. Sometimes concrete data is our starting point and we discover other interesting perspectives as we collect it. But it could also be that we start with a story we want to tell and look for the relevant data needed to give it shape.’
 2
2
 3
3
What were the biggest challenges with your winning project for BMX?
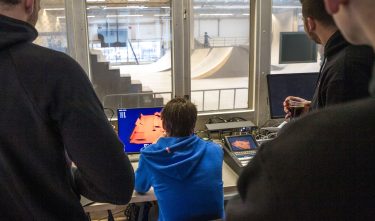
‘You’re trying to track a dynamic sport in three dimensions in a large space, and then to present it live to a large audience. We needed a perfect live-version, understandable and attractive for the audience and accurate and workable for the jury. The biggest challenge is the labour intensity. In the current set-up, you need a large production team on location. We have got it off to a good start, but before this really can become a user-friendly ‘product’, it would be great if we could find a development partner who can add sufficient back-up scenarios in the software so that you only need one or two people at a live event.’
What is the future of data visualisation?
‘We all secretly track a lot of data. The GPS location to use Google Maps, for example, the movement detector that counts our steps and the WiFi-connected temperature sensor on a smart thermostat. I’m sure even more similar services and products will come, but there is also a limit to the amount of information we can and want to record. We will have standard or automated editors who only present us with an overview of the conclusions with relevant insights. On a larger scale, data offers possibilities for smart solutions for continuing to live together happily on this small part of earth. Things like self-driving cars that gather data in order to be able to drive safely, applications used by the government to measure emissions, for example, or solutions that can be used to organise the more efficient flow of traffic or waste processing.’
— 'Design can be seen as a problem solver, and a good design can help to organise data and make it clear.' - Gert
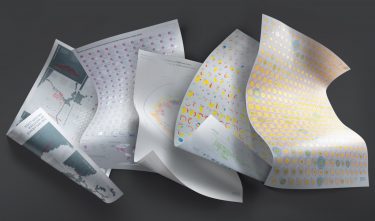
The fact that data is being increasingly integrated can also be seen in the graphic identity you developed for the Eurovision Song Festival 2020. How did you combine data with graphic design in this case?
‘The new graphic identity, called Open Up, is a combination of self-developed software and historic data from the festival. Combining these enabled us to create an iconic identity that maps out history in an authentic way. The colours are based on the national flags and the layout reflects the year in which the country joined the Eurovision Song Festival.’
Data also has negative connotations for many people, because it touches on issues such as privacy and commercialisation. How do you see this?
‘I believe we should form an opinion together about the role of data technology in our lives. As such, we must investigate what the implications are for the use of data by companies and governments, and together decide how much space this kind of technology should be given in our lives. Many people think that data ‘happens’ to them. We have to move away from this. Only then can we come together to set a kind of ethical standard. The data revolution can help to improve how we live together, so let’s together think about how we would like things to be. We made a start with this last November for the city of Utrecht, where we joined forces with RAUM to organise Cirque du Data. A festival full of discussion, insight and expos about how life in the city can be made more attractive using data.’
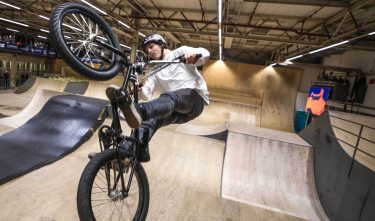
Freestyle BMX to a higher level
The Royal Dutch Cycling Union (KNWU) commissioned CLEVER°FRANKE to put BMX Freestyle firmly on the map as a top sport. The result is a 3D real-time data visualisation that offers fans, jury members, spectators and athletes an exciting and easy-to-understand showcase of the cyclists’ performances. The ‘data-driven’ design agency uses a sensor technology for this (developed by the Urban Sports Performance Centre) that records the speed, lift and orientation of the cyclists. A real-time data visualisation reproduces the performance for the jury, but also for the wider audience.